KeyTime struct uses implicit operator

This is kinda like one of those times when you purchase a car and “all of a sudden” you notice that car way more on the road.  I was working on a Silverlight code sample, and noticed the System.Windows.Media.Animation.KeyTime struct uses the implicit operator to convert from a TimeSpan struct):

public static implicit operator KeyTime(TimeSpan timeSpan);
 

Fun with implicit operators

You can use the [static] implicit operator feature of C# ([Shared] Widening Operator in VB) to implicitly convert types.  For example, suppose you have this class:

class Foo
{
  public Foo(int age)
  {
    this.Age = age;
  }
}

With the correct implicit operator, you could instantiate the object as so:

Foo foo1 = 35;

So, why would you want to do this?  Well, probably in general, you might be leery (for good reason) of adding “implicitness” to your code, so approach doing so with caution.  It can be confusing to throw something atypical like this in code.  However, a fellow colleague of mine used this feature to effectively mimic subclassing the stringclass in a useful way.  He did this by declaring a simple type containing an implicit operator (taking in the custom type, and returning a string).  That custom type was used as the type for parameters instead of string, and hence the “enforcement” of the “custom string”.  At the point the type needed to be a string, the implicit operator was used, so that an instance could be passed wherever a string was needed as well.  In this case, it was like using a c# const, but the available strings were typed analogous to using an enum for integers.  This example could be taken further by inheriting interfaces and/or additional base classes to have different classes of “typed strings”.

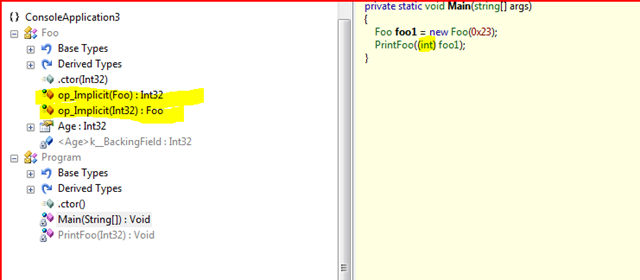
Here’s the compete Foo example followed by the view from Reflector:

namespace ConsoleApplication3
{
  class Program
  {

    static void Main(string[] args)
    {
      Foo foo1 = 35;
      PrintFoo(foo1);
    }

    private static void PrintFoo(int age)
    {
      Console.WriteLine("Foo's age: {0}", age);
    }
  }

  class Foo
  {
    public Foo(int age)
    {
      this.Age = age;
    }
    public int Age { get; set; }

    public static implicit operator Foo(int age)
    {
      return new Foo(age);
    }

    public static implicit operator int(Foo foo)
    {
      return foo.Age;
    }

  }
}

Here’s what it looks like in reflector.  You’ll note the compiler changes to an explicit conversion when calling PrintFoo)

image

Notes from .net developer Group meeting


Tonight the triad developers guild met.  Brian Hitney from Microsoft presented on the “Visual Studio Debugger” and I figured I would not learn to much.  I was wrong; there were a number of great tips I picked up.  Great job Brian!  Brian presented a number of tips, but the *new ones* for me that others might also like to know are..


  • For a multi-threaded app, if you have a bunch of threads going, you can freeze them and show where they are in the debugger (outside the thread you are debugging) by checking “Show Threads in Source”. 

    image

  • Tracepoints are like breakpoints but without pausing execution. Nice for quick and dirty (and super temporary) tracing
  • Calling a method from the watch window bypassed breakpoints, while calling from the immediate window honors them
  • You can create compiler-level variables while debugging, and those variables are dereferenced using the pattern $[your variable name here]. 
    • These variables had a wide scope, so you could use them further up in the stack. I could almost see using this to swap out mock objects while debugging a highly sensitive piece of code that is difficult to *get to*
  • You can drag a segment of code into the watch window (I have traditionally used the shift+f9 [quick watch] window for this) to execute
  • You can use the “Make Object Id” command to effectively set a weak reference to a variable, allowing the developer to effectively widen the scope and lifetime.  Combine this with things like GC.GetGeneration(your variable) and you can track an objects generation in the garbage collector.  Kind of an edge case, and if you find yourself doing *that* you might check out a profiler tool instead.  Still, neat.

image

  • Microsoft released much of the .net source code and debug symbols a while back.  You can go into Tools > Options > debugging in visual studio and configure it to allow the developer to step right into .net framework code.
    • There is a tool called “NetMassDownloader” which can preemptively snag all the source, comments, debug symbols ahead of time rather that JIT-downloading it during debugging.
  • Mole for Visual Studio.   Very cool tool and I plan to use ASAP.  This is basically one honking visualizer on steroids.  Cool extra’s like “favorites”.  Great stuff.


Like I said, several great tidbits this evening.  Never fails, and proves the value in engaging in your local .net user groups.