Tonight the triad developers guild met. Brian Hitney from Microsoft presented on the “Visual Studio Debugger” and I figured I would not learn to much. I was wrong; there were a number of great tips I picked up. Great job Brian! Brian presented a number of tips, but the *new ones* for me that others might also like to know are..
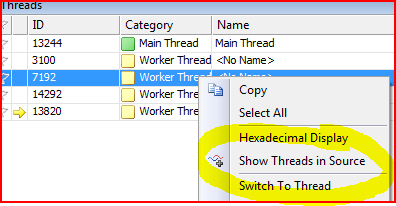
- For a multi-threaded app, if you have a bunch of threads going, you can freeze them and show where they are in the debugger (outside the thread you are debugging) by checking “Show Threads in Source”.

- Tracepoints are like breakpoints but without pausing execution. Nice for quick and dirty (and super temporary) tracing
- Calling a method from the watch window bypassed breakpoints, while calling from the immediate window honors them
- You can create compiler-level variables while debugging, and those variables are dereferenced using the pattern $[your variable name here].
- These variables had a wide scope, so you could use them further up in the stack. I could almost see using this to swap out mock objects while debugging a highly sensitive piece of code that is difficult to *get to*
- You can drag a segment of code into the watch window (I have traditionally used the shift+f9 [quick watch] window for this) to execute
- You can use the “Make Object Id” command to effectively set a weak reference to a variable, allowing the developer to effectively widen the scope and lifetime. Combine this with things like GC.GetGeneration(your variable) and you can track an objects generation in the garbage collector. Kind of an edge case, and if you find yourself doing *that* you might check out a profiler tool instead. Still, neat.

- Microsoft released much of the .net source code and debug symbols a while back. You can go into Tools > Options > debugging in visual studio and configure it to allow the developer to step right into .net framework code.
- There is a tool called “NetMassDownloader” which can preemptively snag all the source, comments, debug symbols ahead of time rather that JIT-downloading it during debugging.
- Mole for Visual Studio. Very cool tool and I plan to use ASAP. This is basically one honking visualizer on steroids. Cool extra’s like “favorites”. Great stuff.
Like I said, several great tidbits this evening. Never fails, and proves the value in engaging in your local .net user groups.